
On this page
About this project
What is the Housing Production Plan?
Under state statute MGL Chapter 40B, cities and towns are expected to provide at least 10% of their total year-round housing units as deed-restricted Affordable Housing. Affordable Housing is deed-restricted housing that eligible low- and moderate-income residents can afford by paying no more than 30% of their annual household income.
As of the most recent state Subsidized Housing Inventory (SHI), about 9.98% of Maynard's year-round housing units are deed-restricted Affordable, just 1 unit short of the 10% threshold. That threshold is measured against the Town's 2020 decennial Census count of year-round housing units, so the denominator resets when the 2030 Census is published and the number of Affordable units Maynard needs to stay at or above 10% will rise as its housing stock grows. A Housing Production Plan is a proactive strategy that sets clear housing goals and a concrete roadmap of actions to increase housing production and affordability, giving the Town more say in how and where new homes are built.
This website version of the plan highlights key observations and findings. The full Housing Production Plan will also be available as a detailed, downloadable PDF.
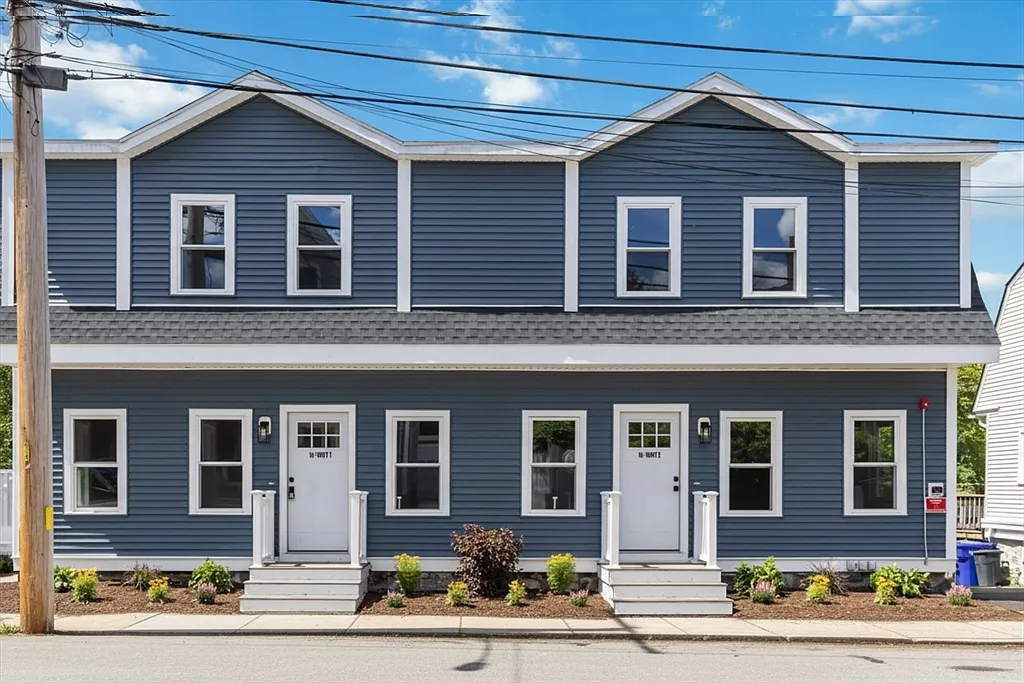
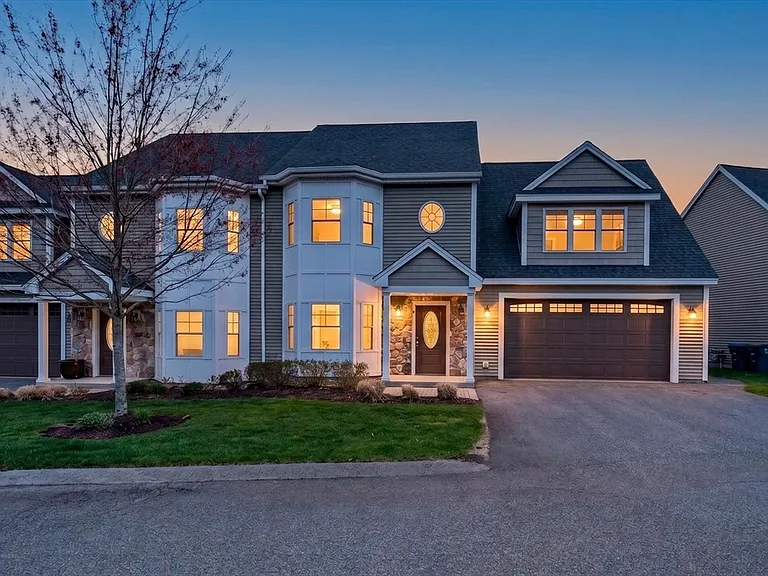
Maynard's housing stock spans single-family homes, two- and three-family houses, and small multifamily buildings. That variety is exactly what a Housing Production Plan works to sustain and expand.
This dashboard is a project of the Town of Maynard and CommunityScale. For questions about local housing policy, contact the Town's Planning & Zoning Division.
Project timeline
Key public moments in Maynard's Housing Production Plan - public forums to weigh in, the Select Board presentation, and the final submission to the state.
- Wed, Jul 29, 2026 · 6:30 PM · confirmedPublic Forum 1Public forumPresent housing-needs findings and gather feedback on the plan's goals.Register on Eventbrite →
- Wed, Oct 7, 2026 · 6:00 PMPublic Forum 2Public forumPresent the draft housing strategies for public input.
- Tue, Nov 17, 2026 · 7:00 PMSelect Board PresentationPresentationRegular Select Board meeting; Planning Board invited.
- Fri, Dec 18, 2026EOHLC SubmissionSubmissionFinal Housing Production Plan submitted to the state.
How affordable is this community?
- ACS 5-year estimates · B19013, B25082, B25090 · 2010–2024
- Zillow ZHVI
- FRED 30-year fixed mortgage rate
- Insurance premium rates (CommunityScale)
This chart tracks whether housing prices are keeping pace with local incomes. The gap between what homes cost and what households can afford reveals affordability trends over time.
| $625,292 | Typical home price (Zillow, Jun 2026) |
| 6.67% | 30-year fixed mortgage rate (Freddie Mac, Aug 2026) |
| 1.57% | Effective property tax rate |
| $1,536 | Average annual homeowner's insurance |
| $131,080 | Median household income (Census, 2026) |
| 30% | Assumed max housing cost share of income |
How is the population changing?
- Census Population Estimates Program (PEP) · 2010–2025
- ACS 5-year estimates · B01001 · 2010–2024
- CommunityScale population projection model
Population growth patterns reveal how communities are evolving. This chart shows historical population changes by age group and projects future trends based on demographic patterns.
Historical population comes from the U.S. Census Bureau's Population Estimates Program (PEP): counties directly from PEP's annual estimates by age, and municipalities from PEP sub-county totals with age detail from the American Community Survey (ACS). Projections use CommunityScale's PEP-anchored cohort-migration forecast model.
The model follows each five-year age cohort through the community's 2010–2024 population history and projects those cohort trends forward, launching from the most recent PEP estimate (2025). Group-quarters residents — college dorms, prisons, military barracks, nursing facilities — do not follow household demographics, so they are separated out, projected on their own trend, and added back. In small communities, where year-to-year cohort data is noisy, the model blends each cohort's trend toward the community's recent overall trend to keep projections stable.
How are households changing by income?
- ACS 5-year estimates · B25007, B01001, B19001, B19113 · 2010–2024
- HUD Income Limits · FY 2025
- BLS CPI-U · 2010–2024
- Census PUMS 5-year · 2019–2023
Understanding how households at different income levels are growing or declining helps identify which groups face the greatest housing pressure and where new housing is most needed.
This chart shows how household composition has changed over time, comparing the distribution of household types between 2015 and 2023. Changes in household types can indicate shifting demographics and evolving housing needs in a community.
How much new housing supply is needed?
- ACS 5-year estimates · B25001, B25004, B25016, B25024, B25042, B25053 · 2020–2024
- HUD Income Limits · FY 2025
- Census PUMS 5-year · 2020–2024
To keep up with growth and fill current housing shortages, Maynard, MA needs 276 new units over the next 5 years.
| 131 |
Units needed to keep up with expected growth
Projected total household growth from 2026 to 2031.
|
| 2.7% |
Projected household growth rate
Expected increase in total households from 4,862 in 2026 to 4,993 in 2031.
|
| 145 |
Units to address shortages in existing housing stock
Production needs to address vacancy rates and other factors.
|
| 23 |
Replacement housing
Effective annual loss rate is 0.9 per 1,000 units.
|
| 55 |
Ownership vacancy adjustment
Owner-occupied vacancy is 0.0%. This is below the minimum stable target of 1.5%.
|
| 66 |
Rental vacancy adjustment
Rental vacancy is 2.4%. This is below the minimum stable target of 7.4%.
|
| 1 |
Substandard housing adjustment
Substandard housing rate is 1.01%. This is above National avg. of 0.98%.
|
| 276 |
Total 5-year housing production need (2026-2031)
|
| 55 |
Annual production pace
Average units needed per year to meet 5-year need
|
| 5.6% |
Total housing unit growth
Percent increase in housing stock over 5 years
|
| 1.1% |
Annual housing unit growth
Average percent increase in housing stock per year
|
How does Maynard compare to its context communities?
Maynard benchmarked against ten context communities across demographic and housing factors: population and household growth, income, home values and rents, cost burden, tenure, and housing mix. Use the dropdown to switch metrics; each is shown as a time series with one line per community, Maynard highlighted.